Intelligence dispatch / AZ-2026-7929
Long Beach Crime Map: Police Data by Neighborhood
Trace official Long Beach police offense records across every published division, switch offense types, and compare the complete 2025 file with 2026 through July 29.

Verified safety brief
The direct answer
Long Beach changes as downtown, the waterfront, the port, and the northern and eastern neighborhoods move through view. The map below follows the official offense trail across police divisions without turning any shaded area into a promise about the next block.
- Data period
- Complete 2025 LBPD criminal incident offense records; optional 2026 view through July 29
- Geographic scope
- Long Beach, grouped into official police divisions built from City Police Reporting Districts
- Last verified
Need one exact area? Open the Long Beach city file or enter a ZIP on the homepage.
City evidence / official records
Long Beach crime map
The city leaves a trail. Choose an offense type, then click any police division to see where the record is thickest.
Every shape carries the selected offense total. No color guessing required.
A deeper red marks higher volume—not a promise about what happens next.
These police lines hold many neighborhoods, commercial corridors, waterfront blocks, and visitor destinations inside the same shape. They are evidence zones, not neighborhood verdicts.
Trace an offense type
A Long Beach address can look calm at noon and feel different after dark. One route ends at a lit storefront. The next ends at a quiet curb with a car left overnight.
This page gives the short read: South Long Beach carries the highest recorded violence, East Long Beach carries the most property crime, North Long Beach stands out for vehicle theft, and West Long Beach has the lowest total count in the city file. That tells you where the pressure sits. It does not judge every block the same way.
The map works best as a street check, not a city slogan. Downtown and the Second Street corridor run hotter for theft tied to foot traffic. East and North shift the warning toward parked cars. West shows fewer total reports, but violence takes a larger share there than in East.
A few numbers frame the picture:
| Area | Main signal | 2024 count |
|---|---|---|
| South | Violent crime | 1,091 |
| East | Property crime | 966 |
| North | Motor vehicle theft | 552 |
| West | Lowest total incidents | 1,616 |
That is the practical split.
If the decision is about a lease, a hotel, a parking routine, or a late walk home, the district view is only the first pass. The same police division can hold a busy nightlife strip, a quiet residential street, and a parking zone with a very different risk pattern. A block near bars and rideshare drop-offs will not read like a block tucked behind homes and shade trees.
The article’s strongest point is simple: city averages hide the route people actually take. Long Beach does not carry one crime pattern. It carries several, and they change by offense type.
A few points matter most:
- Downtown/Central: more exposure to robbery, assault, pickpocketing, and purse snatching tied to dense foot traffic
- Belmont Shore/Second Street: similar South Division pattern, with the warning pulled toward late-night blocks
- East Long Beach: lower violence, but more theft tied to vehicles, parts, and overnight parking
- North Long Beach/Bixby Knolls: strong vehicle-theft signal, especially around curb parking and commercial strips
- West Long Beach: fewer total reports than the other divisions, but a heavier violent share than East
The source limits matter too. LBPD posts new records with about a 21-day delay, incidents are shown to the 100 block, and some crimes are masked or removed from public view. So the map shows where police recorded trouble, not every event that happened.
The clean takeaway: use district numbers to narrow the search, then check the exact beat, block, parking setup, and walking route before making a call. In Long Beach, the street often matters more than the headline.
Is Long Beach Safe? The Reality Pros & Cons
sbb-itb-6d427fc
1. Downtown and Central Long Beach
Downtown Long Beach, including the Convention Center and East Village, sits mostly inside LBPD’s South Division. In the 2024 reporting file, the South District logged 1,848 total incidents, the highest combined count of any Long Beach police district [3]. That number shows the district at a glance, not a verdict on every block. Downtown, East Village, and the Convention Center area appear to shape much of the district’s pedestrian-theft pattern.
Violent Crime Rate
The South District recorded 1,091 violent crimes in 2024 [3]. The file includes aggravated assault, simple assault, robbery, and sexual assault [3]. The pressure points tend to sit where the lights stay on late: nightlife corridors, busy foot traffic, and solo walks after dark. That is where robbery and assault exposure runs higher [3].
The split matters. In this part of the city, the sharper warning falls on person-to-person theft and street exposure more than burglary-led property patterns.
Property Crime Rate
Property crime runs lower here than in other districts. The South District ranked second-lowest for property crime, with 757 incidents in 2024 [3]. The East District, by comparison, logged 966 property crimes in the same year [3]. Motor vehicle theft was the district’s most common property offense, with 361 reported cases [3].
For residents, workers, and hotel guests, the practical read is plain: watch the street first, then the parked car.
Dominant Offense Mix
The clearest signal is personal theft. In 2024, the South District led the city in pocket picking (14 cases) and purse snatching (9 cases) [3]. Those were the highest totals citywide [3]. The pattern fits crowded nightlife stretches and other high-footfall zones, where a distracted second can be enough.
| District | Property Crimes | Violent Crimes | Total Crimes |
|---|---|---|---|
| South (Downtown/Central) | 757 | 1,091 | 1,848 |
| North | 950 | 858 | 1,808 |
| East | 966 | 794 | 1,760 |
| West | 743 | 873 | 1,616 |
2024 LBPD district totals [3]. District totals include multiple neighborhoods and corridors.
Read the table as a district comparison, not a single-neighborhood scorecard. For a closer street view, use LBPD’s Beat Explorer and check the exact blocks you plan to visit, park in, or walk through [1][2].
2. North Long Beach and Upper Westside
North Long Beach and the Upper Westside do not sit under the same crime pattern. They fall in different LBPD districts, and the split shows up fast in the records: North tilts toward property crime, while the West carries more violent crime pressure [3].
Violent Crime Rate
The West District recorded 873 violent crimes in 2024, slightly above North Long Beach at 858 [3]. That matters because the West also had the lowest total crime count among the four districts [3]. In plain terms, fewer total cases did not mean a lighter violent-crime load.
That is why late-night movement in the West calls for more care, especially if a route feels empty or isolated [3].
North Long Beach tells a different story.
Property Crime Rate
The North District logged 950 property crimes in 2024 - the second-highest total across all four districts - and 552 motor vehicle thefts, the highest single-district vehicle theft count in the city [3]. The West District recorded 743 property crimes during the same year [3].
For North Long Beach, the clearest warning sits at the curb. Parked cars, especially overnight, carry the main risk [3].
Incident Mix
| District | Property Crimes | Violent Crimes | Total Crimes |
|---|---|---|---|
| North (North Long Beach) | 950 [3] | 858 [3] | 1,808 [3] |
| West (Upper Westside) | 743 [3] | 873 [3] | 1,616 [3] |
2024 LBPD district totals [3]. Each district covers multiple neighborhoods and corridors.
The totals show the gap. The offense mix shows the meaning.
North Long Beach runs heavier on property crime, with motor vehicle theft and theft from vehicles doing much of the work in that file [3]. The West District stands out for a different reason: violent offenses make up a larger share than property offenses, a pattern that separates it from the rest of Long Beach [3].
District totals still blur several neighborhoods into one frame. Before judging an area, check the exact blocks in the Beat Explorer [1][2].
East Long Beach shifts the pattern again, with a more residential mix of risks.
3. East Long Beach and Residential Corridors
East Long Beach turns the city map in the other direction: less violence, more property crime. The district covers Belmont Heights, Blair Field, and the CSULB campus. In 2024, it posted Long Beach's lowest violent-crime total and highest property-crime total [3].
Violent Crime Rate
The East District recorded 794 violent crimes in 2024, the lowest count among Long Beach's four police districts [3]. On the city file, that places East Long Beach at the low end for violent crime, even if the district is not the lowest in total crime.
Property Crime Rate
The pressure point sits elsewhere. The East District reported 966 property crimes in 2024, the highest count of any district in the city, just above the North District's 950 [3].
The pattern leans hard toward overnight theft around residential corridors, especially vehicle theft [3]. In practical terms, the risk often sits at the curb after dark.
Incident Mix
The district totals show the split plainly.
| District | Property Crimes | Violent Crimes | Total Crimes |
|---|---|---|---|
| East | 966 | 794 | 1,760 |
| South | 757 | 1,091 | 1,848 |
| North | 950 | 858 | 1,808 |
| West | 743 | 873 | 1,616 |
2024 LBPD district totals [3]. Each district covers multiple neighborhoods.
In East Long Beach, the crime mix runs heavily toward property and vehicle-related offenses. The main patterns are motor vehicle theft, theft from vehicles, and theft of vehicle parts [3].
CSULB adds a separate weak point. On the open campus, bike and scooter theft remains common [3].
4. Belmont Shore, Naples, and Coastal Neighborhoods
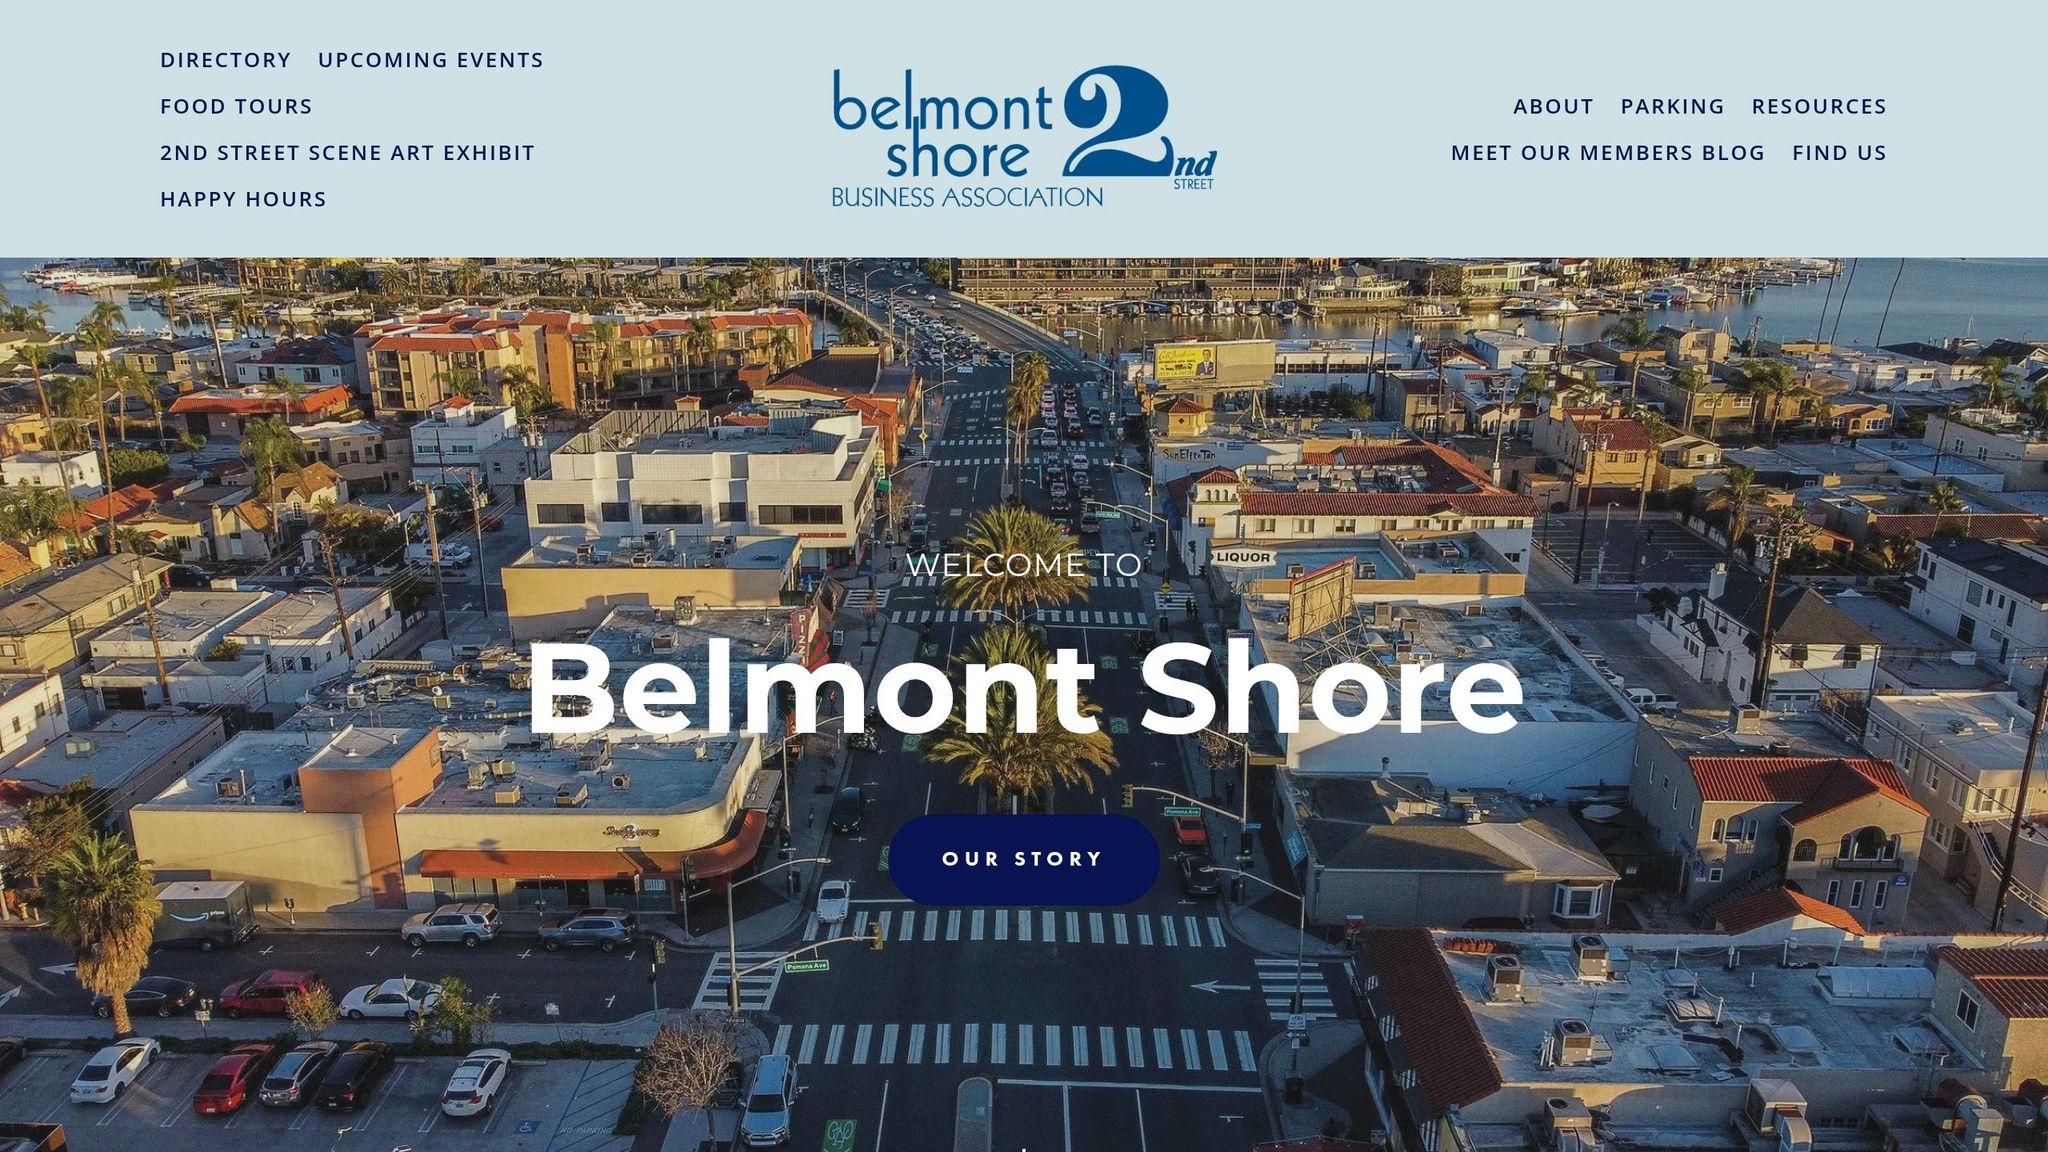
Belmont Shore and Naples fall inside the South District, where the street changes after dark. Foot traffic thickens near the bars, restaurants, and late-night stops, and most of the risk follows that movement. Step away from the entertainment corridor, and the pressure eases.
Violent Crime Rate
Late at night, the pattern tightens around Second Street and the nearby nightlife blocks. The South District recorded the city's highest violent-crime total in 2024, with the heaviest concentration in the blocks that draw the biggest pedestrian crowds after sunset [3].
Property Crime Rate
Property crime runs lower here than in several other districts, but curbside theft remains the main concern [3]. The South District led Long Beach in pocket picking and purse snatching, a pattern tied closely to packed sidewalks along the entertainment corridor [3].
Incident Mix
Naples sits farther from the nightlife strip, and the risk drops on its residential streets [3]. The South District's violent-crime story is shaped far more by the Second Street corridor than by the quieter sections inland from the shore.
For a block-by-block read, check the LBPD Beat Explorer [1][2]. At night, move in groups on Second Street and take a rideshare.
5. Bixby Knolls, Los Cerritos, and Adjacent Areas
Bixby Knolls, Los Cerritos, and the Virginia Country Club area sit inside the North District. In this part of the city, the main risk leans toward vehicle-related property crime, especially near commercial areas and parking zones. The split inside these neighborhoods is not just district-wide. It changes by corridor, block, and street edge.
That is the key read here: not how much crime the district records in total, but where it gathers. Along busy commercial strips. Inside parking lots. On quieter residential streets after dark.
This section narrows the view from the broader North Long Beach picture to the corridor-level pattern around Bixby Knolls. The North District is driven more by vehicle theft than violent crime [3]. In 2024, motor vehicle theft was the main driver, with parts theft and accessories theft close behind [3].
The pattern on the ground is tighter than the district label makes it sound. Property crime clusters around overnight street parking, especially on isolated or poorly lit blocks [3]. One block can feel settled. The next can leave more exposed cars under thinner light.
Bixby Knolls' commercial corridor adds to incident density, and LBPD's Education, Engagement and Enforcement campaign targets the corridor [3]. That matters because commercial traffic, parked cars, and night turnover tend to leave a thicker trail of reports than quiet residential stretches.
For block-by-block differences between commercial strips and residential streets, use the LBPD Beat Explorer [1][2].
How These Neighborhoods Compare on Safety
The split is clear once the city file is laid out. South carries the highest total and the highest violent crime count. East carries the highest property crime count. West records the lowest total incidents [3].
| Neighborhood Group (Police Division) | Violent Crimes | Property Crimes | Total Crimes | Main Pattern |
|---|---|---|---|---|
| South (Downtown, Central, Belmont Shore, Naples) | 1,091 [3] | 757 [3] | 1,848 [3] | Nightlife theft and robbery |
| North (North LB, Bixby Knolls, Los Cerritos) | 858 [3] | 950 [3] | 1,808 [3] | Motor vehicle theft |
| East (East LB, Residential Corridors) | 794 [3] | 966 [3] | 1,760 [3] | Vehicle and parts theft |
| West (Upper Westside) | 873 [3] | 743 [3] | 1,616 [3] | Violent offenses |
The pattern holds across the map. South is the busiest. East leans hardest toward property crime. West stays lowest on total recorded crime.
The range is not small. Violent crime runs from 794 in the East to 1,091 in the South. Property crime runs from 743 in the West to 966 in the East. Total crime runs from 1,616 in the West to 1,848 in the South [3].
Some of that pressure follows foot traffic. Downtown and the Second Street corridor pull in visitors, late hours, parked cars, and more chances for theft and robbery to be reported [3]. That helps explain why South also led the city in pocket picking and purse snatching [3].
That detail matters. It points more to nightlife and visitor corridors than to a broad residential pattern [3].
For a closer read, check the LBPD Beat Explorer at the block level. Use Aden's ZIP reports when the goal is a fast city or ZIP-to-ZIP comparison. The next section tracks where police records are strongest - and where one street can break from the district around it.
Strengths and Limits of Police Data and Free Comparison Tools
The neighborhood patterns above depend on how each source works. Every source leaves part of the street in shadow.
The LBPD Criminal Incident Dashboard is the strongest official source for recent neighborhood-level patterns [2][1]. It updates daily, but the file runs on a 21-day delay to check accuracy [1]. It also masks incidents to the 100 block instead of showing an exact address, and it redacts sensitive crimes such as sexual assault. That can make some blocks look quieter than the full record would suggest [5][6]. For a closer street check, use the Beat Explorer.
For raw files, mapping work, or spreadsheet review, the DataLongBeach open data portal fits better. Some files trail by months, so the Modification date matters before any download [5].
The national reported-crime benchmark uses standardized Part 1 definitions - murder, robbery, burglary, and other serious offenses. That makes it the main tool for city-to-city comparison across the country [4]. The tradeoff is time. It reports annually, so it moves slower than local dashboards, and it does not break incidents down by neighborhood or beat.
Census population data supplies the missing headcount behind crime rates. Raw totals can make busy places like Downtown look riskier than they are, simply because more people pass through them. Per-capita rates correct for that [3]. The catch is geography: the map still has to match the area being compared [7].
| Source | Best Use | Geography | Refresh Cadence | Strength | Limit |
|---|---|---|---|---|---|
| LBPD Crime Dashboard | Recent trends and beat-level filtering | Citywide, Divisions, and Beats | Daily, with a 21-day delay [1] | Official, interactive, includes daily averages and % changes [2] | No exact addresses; no resident-adjusted rates [1][5] |
| DataLongBeach (Open Data) | Raw data downloads and custom mapping | Anonymized blocks [5] | Periodic; can lag months [5] | Downloadable for GIS or spreadsheet analysis | Sensitive locations redacted; requires technical skill [5][6] |
| national reported-crime benchmark | City-to-city benchmarking | Citywide | Annual [4] | Standardized Part 1 definitions for national comparison [4] | Annual lag; no neighborhood detail |
| Census Bureau | Calculating per-capita crime rates | Census tracts and ZIP codes [7] | Periodic updates | Provides population and demographic context [7] | No crime incidents; requires pairing with police data |
| Aden's ZIP | Fast ZIP or city comparison reports | ZIP code and citywide | Varies by source; shows last-verified dates | Free, answer-first reports with sources and limits | Uses the same underlying public data, so the same source limits still apply |
Aden's ZIP packages the same official records into quick ZIP and city comparisons, with last-verified dates attached.
Match the tool to the question in front of you:
- Recent beat patterns: use the LBPD Crime Dashboard
- Raw files or custom maps: use DataLongBeach
- Citywide national comparison: use the national reported-crime benchmark
- Per-capita rates: pair police records with Census Bureau population data
Police records show what was reported and recorded, not everything that happened [3].
Conclusion
The 2024 city file stays consistent from one district to the next: South carried the highest violent-crime total, East led in property crime, North had the most motor vehicle theft, and West finished with the lowest total overall. Those rankings matter. They still do not describe every block the same way.
District totals blur the street-level picture. A loud commercial corridor can post more reports than the residential grid a few turns away. That is why the police record needs a careful read. These numbers show reported incidents, not total risk. LBPD's dashboard updates daily, but the record trails by about 21 days [1]. If a move, job, or commute hangs on one location, check the exact ZIP code or block before making the call.
Use LBPD's dashboard and Aden's ZIP comparisons to check the exact area planned for living, working, or commuting. The district figures here cover 2024, and the dataset was last verified Dec. 4, 2025 [5].
FAQs
Which Long Beach area is safest overall?
Based on a 2024 review of Long Beach crime map records, summarized by Long Beach Current, the South District came out as the safest citywide.
On the city file, this is the district where the noise dropped the most. It posted the lowest total crime count across Long Beach’s four districts: 1,848 incidents. That total included 757 non-violent cases and 1,091 violent cases.
How current is the LBPD crime map data?
LBPD’s interactive crime dashboard updates every day. The catch sits in the fine print: the map runs on a steady 21-day delay while reports move through processing and accuracy checks.
That delay matters. The picture on screen is not tonight’s city. It is the city from about three weeks ago, after the first layer of sorting is done.
The dashboard replaced the department’s monthly PDF reports, though those archived files are still available if you need the older record. All figures should be treated as preliminary until the department finishes its full multi-level review process.
Why can one block feel riskier than the next?
Safety shifts fast in Long Beach. One block stays quiet. The next carries more noise in the police record. Crime is not spread evenly across the city, and the pattern changes by district, neighborhood, and sometimes by the hour.
Violent and non-violent crime do not move the same way, either. Some areas show more street activity after dark. Others see more break-ins, theft from cars, or parked vehicles left alone too long.
Local risk takes shape from what the street is doing. Heavy foot traffic can bring more witnesses, but it can also bring more chances for theft. Nightlife changes the rhythm. So do long rows of unattended cars.
The official Long Beach Police Department Crime Dashboard helps show where those patterns appear on the map.