Intelligence dispatch / AZ-2025-8612
Phoenix Safety: 2025 Crime Data & 2026 Update
Trace the complete official 2025 Phoenix Police incident file across local ZIPs, switch crime types, and see why the exact block still decides the case.
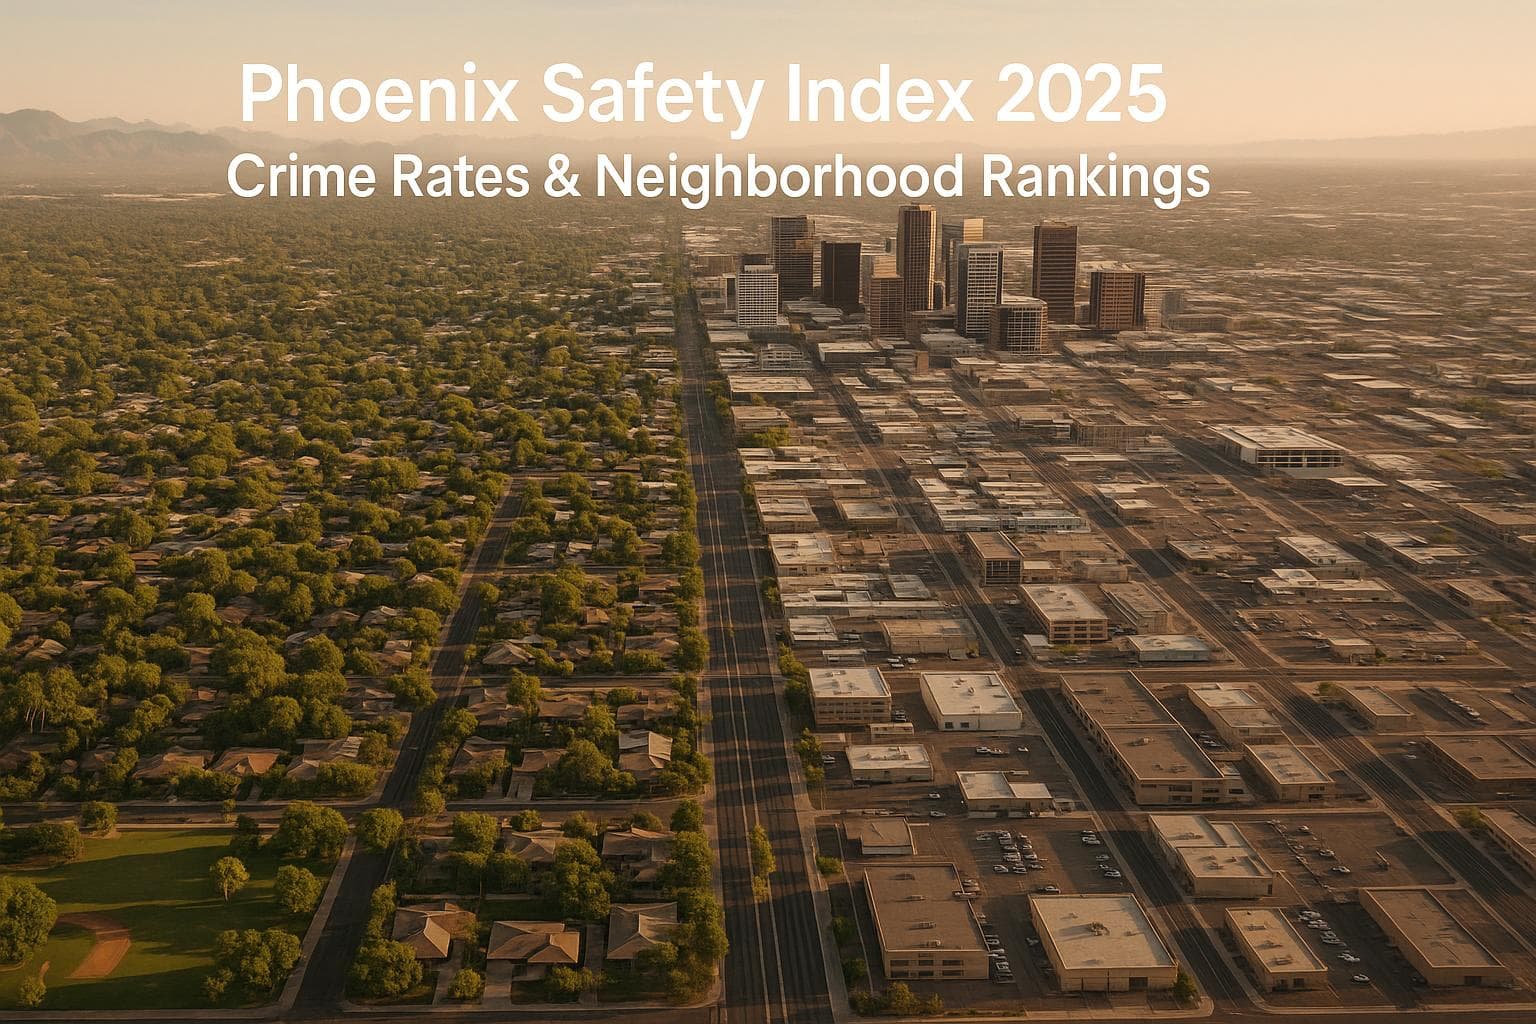
Verified safety brief
The direct answer
Phoenix does not hand out one safety answer. A ZIP can stretch across quiet streets, shopping corridors, freeway edges, and the city line. The 2025 map below opens the last complete local file. The exact route and block finish the case.
- Data period
- Complete 2025 Phoenix Police primary-offense incident file; no area-level 2026 map is available
- Geographic scope
- Phoenix Police incidents grouped by location ZIP and matched to City of Phoenix ZIP polygons that intersect city limits
- Last verified
Need one exact area? Open the Phoenix city file or enter a ZIP on the homepage.
City evidence / official records
Phoenix crime map
The city leaves a trail. Choose an incident type, then click any zip to see where the record is thickest.
Every shape carries the selected incident total. No color guessing required.
A deeper red marks higher volume—not a promise about what happens next.
ZIP borders can cross city lines and fold very different streets into the same shape. They are evidence zones, not neighborhood verdicts.
Trace an incident type
Phoenix's 2025 crime data reveals stark contrasts between neighborhoods. The citywide crime rate stands at 32.7 crimes per 1,000 residents, higher than both the Arizona average (24.9) and the national average (23). While violent crimes like homicides dropped (down 28% from 2023 to 2024), property crimes, particularly auto theft, remain a challenge.
Key Takeaways:
- Safest Neighborhoods: Northern areas like Anthem, Sonoran Foothills, and North Central Corridor report crime rates far below city averages, with violent crime as low as 1.5 per 1,000 residents.
- High-Crime Areas: Central and Western Phoenix struggle with higher crime rates, especially property crimes like auto theft.
- Community Efforts: Gated communities, neighborhood watch programs, and proactive policing contribute to safety in low-crime areas.
Phoenix's safety varies widely by neighborhood, making it crucial to research specific areas before moving or investing.
1. Anthem and Anthem Country Club
Crime Rates
Anthem and Anthem Country Club stand out as some of the safest neighborhoods in Phoenix. Located in the broader North Gateway Village, these communities report a crime rate of about 1,500 incidents per 100,000 people annually. That’s 65% lower than Phoenix’s citywide average of 4,200 crimes per 100,000 residents. To put it another way, residents in North Gateway experience just 15 crimes per 1,000 people compared to 42 per 1,000 across the city.
When compared to national figures, North Gateway fares just as well, with a crime rate 42% lower than the U.S. average of 2,580 crimes per 100,000 people. Nearby neighborhoods like Sonoran Foothills also boast impressive safety stats, with a violent crime rate of just 2.0 per 1,000 residents and a property crime rate of 7.5 per 1,000. Adding to its reputation, North Gateway/Anthem earned a perfect 10/10 safety score in Phoenix Magazine's 2025 neighborhood rankings.
These numbers highlight how safety is deeply embedded in the community’s design and culture.
Community Safety Features
Safety in Anthem and Anthem Country Club goes beyond statistics. The thoughtful layout of these neighborhoods plays a big role. Their location, set apart from the hustle and bustle of downtown Phoenix, creates a quieter, more serene environment. Homes with stunning mountain views, along with trails and parks, encourage outdoor activities and foster a sense of community. This active, engaged atmosphere naturally contributes to a safer environment.
Livability Factors
Safety is just one piece of the puzzle when it comes to what makes these neighborhoods so desirable. Families are drawn here for the top-rated Deer Valley Unified schools, which are known for their excellence. Moreover, the area received another perfect 10/10 score for health, thanks to its outstanding medical facilities and recreational amenities. With the combination of safety, great schools, and beautiful natural surroundings, Anthem and Anthem Country Club offer an ideal setting for families looking for a peaceful, well-rounded community.
2. Sonoran Foothills and Desert Foothills North
Crime Rates
Sonoran Foothills holds the title of the third safest neighborhood in Phoenix for 2025, with a violent crime rate of just 2.0 per 1,000 residents and a property crime rate of 7.5 per 1,000 residents. The neighborhood is home to about 12,000 people. To put this in perspective, Phoenix's overall crime rates for 2025 are significantly higher - 12.12 violent crimes and 34.86 property crimes per 1,000 residents. These numbers also surpass the state average of 24.9 and the national average of 23 . Similarly, Desert Foothills North, situated in the same northern area, is well-regarded for its low crime numbers. Together, these statistics highlight the strong safety profile of these northern neighborhoods.
Safety Trends
Over the years, Sonoran Foothills and Desert Foothills North have consistently ranked as some of the safest areas in Phoenix . While Phoenix saw a 4% drop in overall crime during 2024 - driven by a decline in violent crime - property crime, especially auto theft, is expected to rise citywide in 2025. Despite this trend, these northern neighborhoods, with their already low property crime rates, remain well-positioned to resist such increases. This stability offers residents peace of mind and a secure environment for the long term.
Community Safety Features
The safety of these neighborhoods is no coincidence. Sonoran Foothills is a gated, master-planned community featuring single-family homes on spacious lots, wide streets with limited entry points, and an active neighborhood watch program. Many developments include community centers, private parks, and controlled entry systems - all designed to deter criminal activity. Similarly, Desert Foothills North incorporates features like controlled access and expansive layouts, which naturally discourage crime.
Livability Factors
Beyond safety, these neighborhoods excel in offering a high quality of life. Sonoran Foothills, for instance, provides a tranquil, low-density environment perfect for families. Residents enjoy mountain-view homes, access to trails in the Sonoran Preserve, and top-tier schools. Its location strikes a perfect balance - far enough from downtown Phoenix to feel like a retreat, yet close enough to I-17 for convenient commutes, whether heading into the city or up to the high country. For those prioritizing safety alongside comfort and convenience, these neighborhoods deliver a well-rounded living experience.
3. North Central Corridor
Crime Rates
The North Central Corridor stands out as Phoenix's safest neighborhood in 2025, boasting a violent crime rate of just 1.5 per 1,000 residents and a property crime rate of 5.8 per 1,000 residents. Compare that to Phoenix's overall crime rates - 12.12 violent crimes and 34.86 property crimes per 1,000 residents - and the difference is striking. With a population of 35,000, this neighborhood proves that urban living doesn't have to come at the expense of safety. While the city as a whole reported 8,838 violent crimes and 26,140 property crimes in the first three quarters of the year, the Corridor's numbers remain impressively low.
This contrast highlights the neighborhood's ability to maintain safety, even as the rest of the city faces challenges.
Safety Trends
Year after year, the North Central Corridor has consistently posted the lowest crime rates in Phoenix. While the city experienced a slight rise in violent crime during the first three quarters of 2025, this area has managed to buck the trend. In fact, citywide homicides dropped by 28%, and aggravated assaults fell by 3% - marking three consecutive years of decline. These broader improvements, paired with the Corridor's steadfast safety record, make it an attractive option for those who value security.
Community Safety Features
A combination of proactive measures and engaged residents plays a key role in keeping the North Central Corridor safe. Regular police patrols, community policing efforts, and active block watch programs create a strong security presence and foster a sense of connection among neighbors. The neighborhood's tree-lined streets and historic design naturally encourage foot traffic, creating what urban planners call "eyes on the street", which helps deter crime. Longtime resident Megan Mitchell emphasizes the strong community ties, saying:
Half of our neighborhood has been here since the '70s, and the other half are new families.
This mix of old and new residents creates a sense of cohesion that reinforces the area's safety. Combined with these efforts, the neighborhood's overall livability further enhances its appeal.
Livability Factors
The North Central Corridor offers more than just safety - it’s also an affordable and charming place to live. Rent for one-bedroom apartments starts at just $809, making it a budget-friendly choice. The area includes micro-neighborhoods like Murphy Trails and Beverly Palms, located north of Missouri Avenue along Central Avenue. Residents enjoy walkable streets lined with historic homes, including ranch-style houses, Tudors, Cape Cods, and Georgian Revivals. Phoenix Magazine even ranked the Central Corridor/North Central as #2 in its 2025 "Ultimate Valley Neighborhood Rankings", with an impressive score of 81.8. The neighborhood has managed to preserve its historic charm without being overshadowed by modern trends.
4. Central and Western Phoenix Areas
Crime Rates
Central and western Phoenix reflect the broader safety concerns of the city. These areas share Phoenix's overall crime rate of 32.7 crimes per 1,000 residents, which includes 8,838 violent crimes and 26,140 property crimes recorded during the first three quarters of the year. These numbers underline ongoing safety challenges in these parts of the city.
Safety Trends
While Phoenix experienced a 4% drop in crime citywide in 2024, early projections for 2025 indicate a slight rise in violent crime in the central and western districts. Property crimes remain a significant concern, with auto theft continuing to increase. These trends have prompted local communities to take action.
Community Safety Features
To address these issues, central Phoenix neighborhoods have implemented several measures to improve safety. These include an increased police presence, urban renewal efforts, and the addition of gated apartment complexes. Neighborhood associations are working closely with law enforcement through regular police patrols and community policing initiatives to create safer environments. On a larger scale, citywide programs are using data-driven strategies and partnerships to tackle issues like homelessness and mental health. Additionally, youth-focused initiatives aim to prevent crime by addressing its root causes before it begins.
sbb-itb-6d427fc
Phoenix neighborhood crime patterns in 2025
Strengths and Weaknesses by Neighborhood
Phoenix's neighborhoods reveal a striking contrast when it comes to safety. Northern areas like Anthem and Sonoran Foothills are among the safest in the city, thanks to their modern layouts, well-organized private security, and highly active neighborhood watch programs. On the other hand, Central and Western Phoenix face persistent challenges, with crime rates - particularly property crimes like auto theft - consistently higher than those in the north.
These differences emphasize the importance of analyzing safety at the neighborhood level. While areas in the north enjoy crime rates significantly below the city average, central and western neighborhoods continue to grapple with security concerns. This comparison underscores the value of implementing tailored safety initiatives and making informed decisions when considering relocation within Phoenix.
| Neighborhood Area | Key Strengths | Primary Weaknesses |
|---|---|---|
| Anthem & Anthem Country Club | Modern developments, private security, strong community involvement | No major safety concerns |
| Sonoran Foothills & Desert Foothills North | Highly active neighborhood watch programs | No major safety concerns |
| Central & Western Phoenix | - | Elevated crime rates, especially auto theft |
Conclusion
Phoenix's safety landscape in 2025 paints a divided picture. Northern neighborhoods like Anthem, Anthem Country Club, Sonoran Foothills, and Desert Foothills North continue to enjoy low crime rates, thanks to strong community safety initiatives. Meanwhile, Central and Western Phoenix grapple with higher property crime rates, particularly auto theft. With an overall crime rate of about 32.7 per 1,000 residents, Phoenix remains above both state and national averages. However, there’s a silver lining: violent crime has seen a decline, with homicides dropping by 28% and aggravated assaults decreasing by 3%. The northern areas benefit from modern designs and proactive security measures, while central regions face the persistent challenges of urban living.
When considering a neighborhood in Phoenix, it’s important to look beyond the statistics. Visit potential areas at different times to observe lighting, activity levels, and the overall atmosphere. Pay attention to security features like well-lit parking areas, gated access, and keycard systems. These can not only improve safety but might also qualify you for renter’s insurance discounts. Engaging with the community can provide valuable insights - chat with neighbors, read online reviews, or participate in local Block Watch programs.
Ultimately, your choice should align with your safety priorities and lifestyle needs.
FAQs
What makes neighborhoods like Anthem and Sonoran Foothills safer places to live?
Neighborhoods like Anthem and Sonoran Foothills are known for their safety, thanks to a combination of thoughtful features and proactive measures. Key elements include active community watch programs, gated entrances, and private security systems. These newer developments also tend to emphasize crime prevention and proactive policing, adding another layer of protection.
The presence of well-kept parks and engaged neighborhood associations fosters a strong sense of community. This shared vigilance among residents helps create a supportive and secure environment where people can feel at ease.
Why do crime rates tend to be higher in Central and Western Phoenix compared to the northern neighborhoods?
Crime rates in Central and Western Phoenix are typically higher, and there are a few key reasons behind this trend. These areas often have denser urban populations, which naturally creates more opportunities for property-related crimes, particularly in and around the downtown area. On top of that, challenges such as homelessness and gang activity are more prevalent in these parts of the city, further contributing to the elevated crime levels.
On the flip side, neighborhoods in the northern parts of Phoenix generally see lower crime rates. This can be attributed to factors like stronger economic stability, less crowded living conditions, and a heightened emphasis on community safety programs. These contrasts underscore how local conditions can significantly influence neighborhood safety.
What are the best ways to evaluate the safety of a Phoenix neighborhood before moving?
To get a sense of how safe a neighborhood in Phoenix is, begin by checking out crime statistics and maps from the Phoenix Police Department. These resources give you current details about crime patterns in different areas of the city. You can also use online platforms that combine crime data with community reviews to give a broader picture of neighborhood safety.
Beyond the numbers, it’s helpful to visit the area at various times of the day. Talk to local residents to hear their experiences and take note of the neighborhood's overall vibe. Look for things like proper street lighting, active community presence, and the availability of nearby amenities - these details can offer extra insight to help you make an informed choice.