Intelligence dispatch / AZ-2026-5253
Houston Crime Map: Neighborhood & ZIP Safety Data
Trace official HPD NIBRS offense counts across twenty-five police districts and compare the complete 2025 file with 2026 through June 30.

Verified safety brief
The direct answer
Houston is too wide for one safety label. The official trail shifts across twenty-five police districts, and the map below keeps the period and offense type fixed while the city changes beneath them.
- Data period
- Complete 2025 HPD NIBRS offenses; optional 2026 year-to-date view through June 30
- Geographic scope
- City of Houston, grouped into twenty-five official HPD districts
- Last verified
Need one exact area? Open the Houston city file or enter a ZIP on the homepage.
City evidence / official records
Houston crime map
The city leaves a trail. Choose a report type, then click any police district to see where the record is thickest.
Every shape carries the selected report total. No color guessing required.
A deeper red marks higher volume—not a promise about what happens next.
HPD districts can hold several neighborhoods, business corridors, venues, airports, and very different daily populations. They are evidence zones, not neighborhood verdicts.
Trace a report type
A Houston street can change fast after dark. One stretch stays bright and busy. Two miles later, the blocks thin out, the traffic fades, and the risk can look different on paper.
This page gives the short answer: no single Houston crime map tells the whole story. The clean read starts with the city number, then moves down to the ZIP, the beat, and finally the exact block. That order matters because a city headline can hide a rough corridor, and a rough corridor can sit beside a calm one.
The main verdict: use HPD records for block and beat checks, ZIP reports for side-by-side area comparison, and Texas DPS or FBI records only for the city as a whole. Each source shows a different slice of Houston. None should be read alone.
The records also stop at the Houston Police Department line. Places such as Bellaire and West University Place sit near Houston, but they file through their own departments. A map can look full at first glance. It is not.
One more warning sits near the top of the file: darker areas mean more police reports, not a personal forecast. Busy streets, shopping zones, and heavy traffic leave more recorded trouble than quiet residential blocks. That is why rates per 100,000 people work better than straight counts when comparing one area to another.
The pattern across the article is plain:
- HPD Community Crime Map shows where police recorded incidents down to the hundred-block
- ZIP safety reports make it easier to compare one postal area with another
- Texas DPS gives the citywide Houston rate in a Texas frame
- FBI data places Houston against the national picture
Some of the sharpest takeaways sit in the contrast. The article notes that property crime runs 25% above the national average, while violent crime is close to the national rate. It also shows how one neighborhood can read far calmer than another, even inside the same city headline.
That is the point of the map search. Not fear. Precision.
Think of Houston as a file with layers. The city rate sets the mood. The ZIP shows the area. The beat narrows the route. The block shows where the pattern starts to take shape.
Best use of this guide: start wide, cut down the search area, then check the street itself before making a call on an apartment, hotel, parking habit, or commute.
Houston Crime Map Tutorial - Find Incidents, Heatmaps & Alerts
sbb-itb-6d427fc
1. Aden's ZIP Houston City Safety Report
The Aden's ZIP Houston city safety report is the citywide baseline for Houston Police Department jurisdiction. It breaks the file into districts and beats, then converts crime counts to per 100,000 residents [1] [4]. That matters because a busy part of the city can be read against a quieter one without relying on raw totals alone.
The report also splits the city into HPD beats, Super Neighborhoods, and Open Location Code (OLC) grids. The map moves from the full city view down to local patterns, one layer at a time. A broad signal at the city level can then be checked against the streets and zones beneath it.
Start with the city report. Then move to neighborhood and ZIP pages for a closer read. After that, the Houston Police Department Community Crime Map adds incident-level detail inside the same jurisdiction.
2. Houston Police Department Community Crime Map
The city report sets the baseline. The HPD Community Crime Map takes the reader closer to the street.
It runs on NIBRS incident records, which hold more detail than the older UCR system, and the archive reaches back to 2009 [1][2]. That matters because the map does not just show a neighborhood label. It shows the trail underneath it.
The view tightens in stages. One layer covers police districts. Another drops to beats. Then the map narrows again to hundred-block street ranges, with exact addresses hidden for privacy [1]. HITS also posts Super Neighborhood and OLC summary layers [2]. The 8-digit OLC block covers about 900 feet. The 6-digit block stretches about 3.41 miles [2].
This map shows raw incident counts, not rates adjusted for population. A darker beat can simply mean more people, more traffic, or more places where police reports happen. HPD says not to compare beats head-to-head on raw totals because each beat covers a different population size [1].
The border problem gets sharper at the ZIP level. ZIP codes and police beats do not line up cleanly. A single ZIP can hold parts of several beats, and one beat can cut across several ZIPs [1]. For neighborhood-to-neighborhood comparison, ZIP-level reports are the better fit. The HPD map does a different job: it helps trace the exact blocks behind a pattern that already showed up in the city file or a ZIP report.
Use it like the city’s evidence board. Start with the broad pattern. Then zoom in until the street starts to take shape.
| Geographic Level | Detail | Practical Use |
|---|---|---|
| Hundred-block range | Street-level, privacy masked [1] | Specific block research |
| 8-digit OLC grid | ~900 feet [2] | Fine GIS mapping |
| Police beat | Local reporting unit [1] | Standard local reporting area |
| Super Neighborhood | City-defined community boundary [2] | Community planning and comparison |
| Police district | Multiple beats combined [1] | Administrative overview |
Where This Came From: HPD monthly crime data current through the most recent reporting period as of July 30, 2026; historical archives back to 2009; HPD GIS summary layers for Super Neighborhood and OLC grids. Key limits: raw counts only, no per-capita rates; ZIP and beat boundaries do not align; NIBRS can appear higher than older UCR-based reporting at first because it records more detail [1][2]. Sources: Houston Police Department Crime Statistics, City of Houston Open Data – HITS GIS Layers.
3. Texas DPS Crime in Texas: Houston PD Jurisdiction Data
Texas DPS's Crime in Texas report gives the clean citywide view. It tracks Houston PD's jurisdiction, not a county file that can pull in other agencies and a much larger map.[6]
The report uses NIBRS. That means crime rates are shown per 100,000 residents, so Houston can be lined up against other Texas cities on the same scale. Historical Houston dashboards run from 2015 through the current year. Before the search moves block by block, this is the clearest place to read the city's full case file.
The HPD map shows where reports bunch up. DPS shows how Houston performs as one jurisdiction. Use it as the benchmark when comparing Houston's citywide crime rate with Texas and other major cities.
The tradeoff is simple: local detail disappears. This report gives one citywide rate, not the neighborhoods or ZIP codes behind it. A citywide number is not a street-level warning, and it should not be read as an address-level risk.
The clean route looks like this:
- Start with DPS for the citywide benchmark.
- Then use the HPD map and ZIP reports to narrow the search.
- Next, move from citywide rates to ZIP-code safety reports for neighborhood-level comparison.
Where This Came From: Texas DPS Crime in Texas report, HPD jurisdiction data, and multi-year trend dashboards covering 2015 through the current year. Data current as of July 30, 2026.[1][2][6] Key limits: jurisdiction-wide rates cannot be applied to individual neighborhoods or ZIP codes; NIBRS adoption may initially make reported crime appear higher because of greater reporting specificity.[1][2] Countywide figures can include agencies beyond HPD and cover a broader area.[6] Sources: Texas Department of Public Safety – Crime in Texas, Houston Police Department Crime Statistics.
4. national reported-crime benchmark: Houston City Crime Data
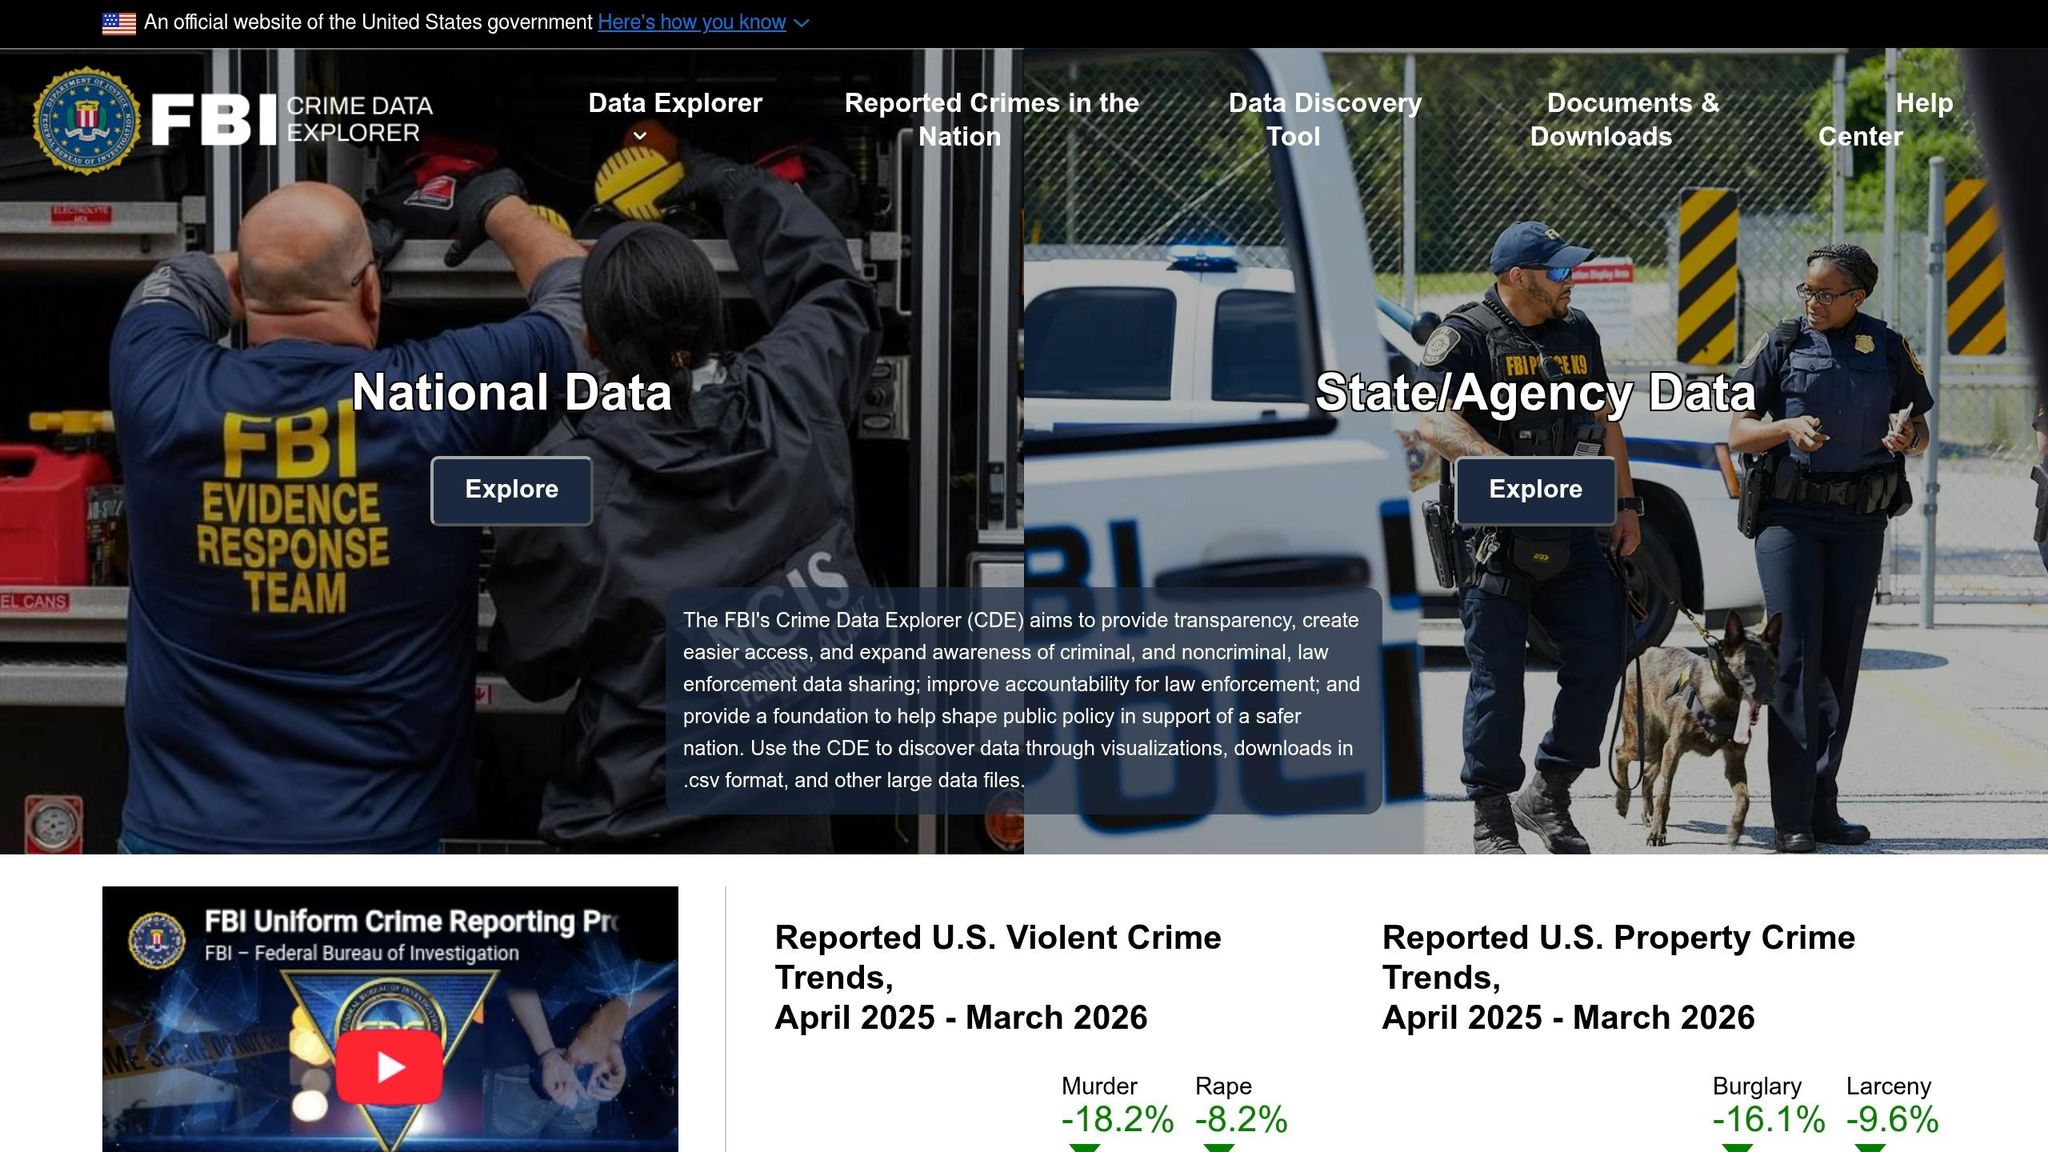
For a federal benchmark, the national reported-crime benchmark puts Houston on the same board as the rest of the country. It draws from the Uniform Crime Reporting (UCR) Program and the newer National Incident-Based Reporting System (NIBRS), which records incidents in more detail.[1] Houston's historical UCR series runs from 1985 to 2004.[5]
This is the city-level view. Useful for scale, blunt for street decisions.
The limit sits in the map itself: the FBI Explorer does not split crime by neighborhood or ZIP code. Houston's citywide totals can look steady while one part of the city runs hot and another stays quiet.
| Crime Category | Houston Rate (per 100K) | vs. National Average |
|---|---|---|
| Violent Crime | 381.2 | 0% |
| Property Crime | 2,291.6 | +25% |
| Murder | 5.3 | +5% |
| Larceny and theft | 1,629.7 | +16% |
| Vehicle Theft | 360.1 | +13% |
The pattern is plain. Violent crime sits in line with the national rate, while property crime runs higher. The heavier pull comes from theft and vehicle theft, the kind of numbers that shape how people park, lock up, and move through the city after dark.
Use this as the federal benchmark. The neighborhood and ZIP picture comes next.
Where This Came From: national reported-crime benchmark and Houston Police Department Crime Statistics. Data current as of August 2026.[1][3][5] Key limits: the FBI Explorer does not provide neighborhood or ZIP-code breakdowns; NIBRS adoption can initially make reported crime appear higher due to more detailed reporting.[1][2] Sources: national reported-crime benchmark, Houston Police Department Crime Statistics.
5. Aden's ZIP Houston ZIP-Code Safety Reports
Citywide numbers set the backdrop. ZIP-level reports bring the lens down to one part of Houston, where the street pattern starts to change and the city stops looking uniform.
That is where these reports matter most. They sit between citywide rates and beat-level maps, giving readers a cleaner way to compare one Houston ZIP code against another.
Aden's ZIP provides free Houston ZIP-code safety reports using HPD's NIBRS crime data. Rates are shown per 100,000 residents, which lets ZIP codes of different sizes be compared on the same scale.[4] Historical records run back to 2009, and the reports reflect updates through July 30, 2026.[1]
One caution stays on the file: ZIP codes and police beats do not match. A ZIP report works best as a comparison tool, not as a map of patrol lines.
The practical move is simple:
- Use ZIP reports to compare nearby areas and the crime patterns tied to each one.
- Use HPD monthly beat data when the block-by-block picture matters more.
The ZIP view shows the pattern from above. Beat-level records go one step closer to the street.
Where This Came From: Aden's ZIP Houston ZIP-code safety reports; Houston Police Department NIBRS crime data; City of Houston open-data portal. Data current as of July 30, 2026.[1] Key limits: ZIP boundaries do not match police beat boundaries, and rates per 100,000 residents help normalize for population differences.[1][4] Sources: Aden's ZIP, Houston Police Department Crime Statistics, City of Houston Open Data Portal.
How Houston Crime Patterns Differ Across City, Neighborhood, and ZIP Boundaries
The city number sets the mood. It does not tell the whole story.
Houston crime looks different at the city, neighborhood, beat, and ZIP level because each record draws the map a different way and measures something slightly different.
At the citywide level, property crime runs 25% higher than the national average, while violent crime sits close to the national average.[3] That gives useful context. It also blurs what happens across more than 113 neighborhoods.
Move down to the neighborhood map and the contrast gets sharp. Green Trails posts a Crime Index of 6, which puts it 94% below the national average. Fourth Ward lands at a Crime Index of 195, or 95% above it.[3] One city figure can hide a lot. Most Houston neighborhoods sit in the safer bands, while a smaller group pulls the city average upward.
Table: Local Area Safety Comparison by Neighborhood (August 2026)[3][4]
| Neighborhood | Crime Index (100 = National Avg) | Police Beat |
|---|---|---|
| River Oaks | 66 | 1A40 |
| The Heights (Central) | 142 | 2A30 |
| Midtown | 166 | 10H40 |
| Fourth Ward | 195 | 2A40 |
ZIP codes help with broad area checks. Police beats get closer to the street.
The catch is simple: ZIP lines and police beat lines do not match. One ZIP can spill across several beats, which makes ZIPs better for rough comparison than pinpoint reading.[1] Beats work as the finer incident unit.
For the closest Houston read, use police beats. And when comparing one beat to another, use rates per 100,000 residents instead of raw incident counts. A busy commercial zone and a quiet residential area do not generate reports the same way, so straight totals can mislead.[1]
Where This Came From: Aden's ZIP Houston safety data; Houston Police Department NIBRS crime data; City of Houston open-data portal; national reported-crime benchmark. Citywide crime index and neighborhood grades current as of August 2026.[3] Key limits: Crime Index scores reflect reported incidents only; ZIP boundaries do not match police beat boundaries; raw incident counts are not a direct measure of personal risk.[1][3] Sources: Aden's ZIP, Houston Police Department Crime Statistics, City of Houston Open Data Portal, national reported-crime benchmark.
Pros and Cons of Crime Maps and ZIP Safety Reports
Houston’s safety picture changes with the map scale. One source watches the whole city from high above. Another drops to the block where a single corner can change the mood of a street. Reading them the same way is where mistakes begin.
The table below works like a field guide. It shows what each source does well, where it can mislead, and when to slow down before making a call.
| Source | Strengths | Limits | Best for | Use with caution when |
|---|---|---|---|---|
| HPD Monthly Crime Data (NIBRS) | Most granular; updated monthly; 52 Group A offense classes [1] | Raw counts only; no per-capita rates; HPD discourages direct beat comparisons [1] | Checking recent activity on a specific block or street | Comparing two different neighborhoods side by side |
| HPD Community Crime Map | Street-level incident detail; layered view by district, beat, and block; official HPD source | Raw counts only; no per-capita rates; beat boundaries do not match ZIPs | Tracing block-level patterns inside HPD jurisdiction | Comparing neighborhoods by total counts alone |
| national reported-crime benchmark | Standardized for national comparison; reliable historical baseline [5] | Citywide only; best for annual and historical comparison, not live risk [5] | Long-term citywide trend analysis | Assessing risk for a specific address or street |
| Texas DPS Crime in Texas Reports | Statewide context; consistent methodology across Texas agencies | Less granular than HPD beat or ZIP data | Placing Houston in a statewide picture | Evaluating conditions in a specific ZIP or beat |
| ZIP Safety Reports (Aden's ZIP) | Familiar geographic units; free; quick comparison between ZIP codes | ZIP lines do not match police beat lines; one ZIP can mask wide internal variation [1] | Quick comparison between ZIP codes | Treating a single ZIP as uniform [1] |
Match the source to the question. If the goal is a city trend, use a city-level file. If the goal is a block check, move closer to the street.
Counts help spot where trouble clusters. After that, the map needs a second pass with rates and boundary-aware comparisons before any firm judgment. That matters in Houston, where NIBRS can make recent totals look higher because it records more offense detail.
The safest reading order is simple: start wide, then tighten the frame.
Where This Came From: HPD NIBRS methodology documentation; national reported-crime benchmark; Texas DPS Crime in Texas reports; Aden's ZIP Houston safety data. Data current as of August 2026. Key limits: NIBRS transition may inflate apparent crime volumes; ZIP boundaries do not align with police beats [1][3]. Sources: Houston Police Department Crime Statistics, national reported-crime benchmark, Texas DPS Crime in Texas, Aden's ZIP.
Conclusion
The city file does not close with one number.
Houston's crime rate sits 3% above the national average as of August 2026, but that citywide figure smooths over a much sharper street-level split. Some neighborhoods run quieter. Others carry more recorded trouble. Treat the city rate as a baseline, not a street verdict.
The source should match the question. HPD's monthly NIBRS records work best when the search narrows to a block, a corridor, or one stretch of street. FBI and Texas DPS records help frame the city as a whole. ZIP reports help with fast side-by-side checks, but postal lines are not police lines. HPD puts it plainly: "ZIP code boundaries and police beat boundaries do not correspond." [1] That makes a ZIP score a first screen, not a final answer for any address.
The free Aden's ZIP Houston city report, individual ZIP-level safety reports, comparison pages, and map pages cover the full span - from the citywide pattern down to postal-area detail [3].
Start wide. Tighten the frame. Then check the exact block.
Where This Came From: HPD crime statistics and NIBRS methodology; national reported-crime benchmark; Texas DPS Crime in Texas reports; Aden's ZIP Houston safety data. Data current as of August 2026 [3]. Key limits: NIBRS transition may inflate apparent crime volumes; ZIP boundaries do not align with police beats [1]. Sources: Houston Police Department Crime Statistics, national reported-crime benchmark, Texas DPS Crime in Texas, Aden's ZIP.
FAQs
How do I check crime on a specific Houston block?
Use the official Houston Police Department monthly crime portal as the city’s case file. Start with the interactive beat map or the beat list, find the area that matters, then choose a month. The records show reported offenses by hundred-block and street name. Exact addresses stay off the page for privacy.
For a broader read, the city’s Power BI crime dashboard lets you track patterns by place, offense type, and police beat. One tool shows the street-level trace. The other shows how the pattern moves across the map.
Why can one Houston ZIP code look safer than another?
One Houston ZIP code can seem calmer than the next because trouble does not fall evenly across a city this large. The map shifts block by block, and the reporting lines behind it do not always line up cleanly.
ZIP codes are blunt tools. They do not match police beats, and a single ZIP code can spill across several of them. Since crime is often recorded by district, beat, or grid, a ZIP code works best as a rough location marker - not a precise way to judge safety against another area.
What does a darker area on the Houston crime map mean?
A darker patch on the Houston crime map usually means more reported crime incidents were recorded in that grid or zone.
The stronger the color, the more police reports were filed there than in lighter areas nearby. Think of it as the city’s evidence board after dark: brighter trouble signals in some blocks, quieter paper trails in others. The map shows recorded crime density, not an official neighborhood safety ranking.