Intelligence dispatch / AZ-2025-4589
Philadelphia Crime Map: 2025 Incidents by ZIP (2026 Update)
Explore an interactive Philadelphia crime map using official 2025 PPD incidents by ZIP, filter crime types, compare reported volume, and open every ZIP report.
Verified safety brief
The direct answer
Philadelphia is not uniformly safe or unsafe. Reported incident volume varies sharply by ZIP, and the most useful answer is the exact area, crime type, and time period shown in the live map below.
- Data period
- Complete 2025 incidents; optional 2026 year-to-date view
- Geographic scope
- Philadelphia Police Department incidents spatially joined to City of Philadelphia ZIP-code polygons
- Last verified
Need one exact area? Open the Philadelphia city file or enter a ZIP on the homepage.
City evidence / official records
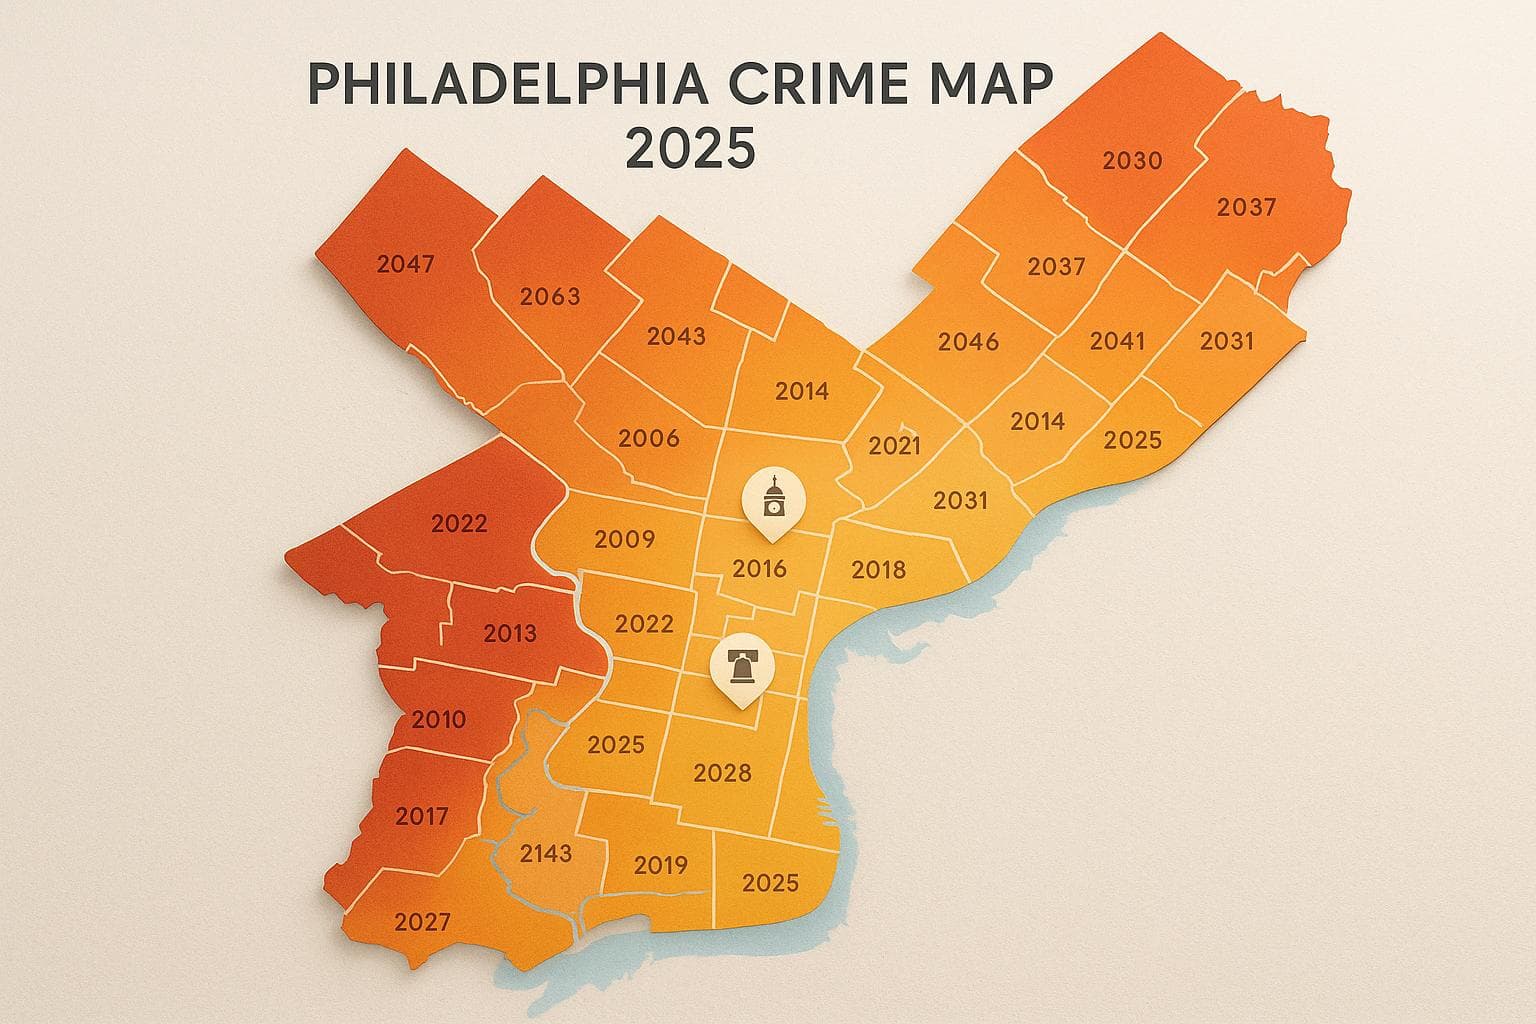
Philadelphia crime map
The city leaves a trail. Choose an incident type, then click any zip code to see where the record is thickest.
Every shape carries the selected incident total. No color guessing required.
A deeper red marks higher volume—not a promise about what happens next.
Philadelphia ZIP codes cross neighborhood names, corridors, and very different land uses. They are evidence zones, not neighborhood verdicts.
Trace an incident type
Philadelphia's crime rates improved significantly in 2025, with violent crime dropping by 9.96% and property crime by 8.25%. The city reported 208 homicides, 11,086 violent crimes, and 32,670 property crimes as of December 10. Despite the progress, safety varies widely across neighborhoods, making detailed crime data essential for informed decisions.
Key Highlights:
- Safest Neighborhoods: Chestnut Hill, Somerton, West Mount Airy, Manayunk, Fairmount, Bella Vista, East Falls, and East Oak Lane have lower crime rates than the city average.
- High-Crime Areas: Upper Kensington, Cobbs Creek, and Strawberry Mansion remain some of the most dangerous neighborhoods.
- Citywide Crime Rates: Violent crime is 2.728 per 1,000 residents, and property crime is 14.74 per 1,000 residents.
- Neighborhood Insights: Tools like AdensZip provide ZIP-level crime data and livability scores, helping residents balance safety, affordability, and lifestyle factors.
While overall safety has improved, understanding neighborhood-specific risks is critical for making better decisions about where to live or work.
How to Read Philadelphia's 2025 Crime Map
Crime Map Features and Tools
Philadelphia's crime patterns come to life through interactive mapping tools. The Philadelphia Police Department (PPD) offers a map that pinpoints crime locations across the city, giving residents and analysts a detailed view of incidents. Meanwhile, the Philadelphia Controller's Office provides a specialized application focused on tracking gun violence victims in 2025. This tool includes filters for deeper insights. As of December 8, 2025, the map reports 898 shooting victims - 712 nonfatal and 188 fatal. Additionally, third-party platforms like The Trace utilize choropleth maps, which visually represent crime density by shading neighborhoods based on incident rates. These tools are invaluable for translating raw data into practical safety insights.
Important note: Be cautious when using PPD crime data retrieved between January 30 and February 21, 2025, as calculation errors were identified during this period.
Reading Heatmaps and Crime Rate Numbers
Choropleth maps use color intensity to highlight crime density. Darker shades and clusters of incident markers indicate areas with higher crime rates.
Crime rates are often presented as incidents per 1,000 residents, which allows for fair comparisons between neighborhoods of different sizes. For example, Philadelphia's violent crime rate for 2025 is 2.728 per 1,000 residents, while property crime stands at 14.74 per 1,000. Chestnut Hill, a neighborhood in the city, reports a violent crime rate of just 2.260 per 1,000 residents - significantly lower than the citywide average. These figures are crucial for assessing neighborhood safety and livability.
Using AdensZip for Crime and Livability Data

AdensZip takes crime analysis a step further by integrating it with livability metrics. This platform provides ZIP-level crime data alongside information on climate, cost of living, and real estate. Users can generate detailed reports, complete with AI-driven recommendations that weigh factors like crime risk, affordability, commute times, and lifestyle preferences. This comprehensive approach makes AdensZip a valuable tool for comparing Philadelphia neighborhoods and finding the right balance between safety and other priorities.
Philly Crime Update in 2025
Philadelphia's Safest Neighborhoods in 2025
Let’s take a closer look at Philadelphia’s safest neighborhoods in 2025, based on updated crime data and trends.
Neighborhoods with Lower Crime Rates
Some of the neighborhoods standing out for their safety in 2025 include Chestnut Hill, Somerton, West Mount Airy, Manayunk, Fairmount, Bella Vista, South Philadelphia West, East Falls, and East Oak Lane. These areas report violent crime rates that are below the city’s average, making them attractive options for residents seeking peace of mind.
Safety by the Numbers
Philadelphia has seen a positive shift in safety citywide. Violent crime has decreased by 9.96% compared to 2024, with 312 fewer assaults and robberies reported. Property crime has also seen a notable drop of 8.25%, translating to approximately 5,000 fewer incidents. These improvements reflect broader efforts to enhance safety across the city.
Using AdensZip to Evaluate Neighborhoods
If you’re weighing your options, AdensZip can help. This AI-powered tool provides ZIP-level insights that combine crime data with other key factors like cost of living, real estate trends, commute times, and local amenities. Whether you’re drawn to the charm of Chestnut Hill, the convenience of East Falls, or the vibrant atmosphere of Bella Vista, AdensZip can help you find a neighborhood that aligns with your safety needs, budget, and lifestyle.
sbb-itb-6d427fc
Philadelphia's Highest-Crime Areas in 2025
While Philadelphia has seen some progress in reducing crime, certain neighborhoods continue to face significant safety challenges. These areas influence decisions about where people choose to live, work, or visit.
Crime Hotspots Based on 2025 Data
Upper Kensington tops the list as Philadelphia's most dangerous neighborhood, with 951 shootings reported between 2015 and 2024 - the highest in the city during that timeframe. Over in West Philadelphia, Cobbs Creek recorded 605 shootings, while Strawberry Mansion in North Central Philadelphia reported 519 shootings, placing it seventh citywide during the same period. Even with broader citywide improvements, these neighborhoods remain hotspots for gun violence.
Philadelphia ranks among the top 100 most dangerous cities in the United States, with crime rates higher than 99% of other communities in Pennsylvania. Residents face concerning odds: a 1 in 101 chance of falling victim to violent crime and a 1 in 20 chance of experiencing property crime. On top of that, the city struggles with one of the nation's highest motor vehicle theft rates, with a 1 in 65 chance of having a car stolen. These statistics highlight the severity of the challenges faced by residents and visitors alike.
Why These Areas Have Higher Crime Rates
The elevated crime rates in these neighborhoods are tied to long-standing socioeconomic issues and systemic inequities that disproportionately affect Black and brown communities.
Environmental factors also play a role. For example, abandoned rowhouses often turn into makeshift boarding houses, creating conditions that can heighten safety risks. A tragic shooting in September 2025 in Strawberry Mansion serves as a stark reminder of the dangers in these environments.
Weighing Crime Risk Against Other Factors with AdensZip
Understanding these risks is essential, especially when weighing the pros and cons of living in high-crime areas. While these neighborhoods may offer lower housing costs and proximity to job opportunities, the safety concerns present tough trade-offs for residents.
AdensZip provides a tool to help navigate these decisions by combining crime statistics with data on housing affordability, job prospects, commute times, and local amenities. Its AI-powered analysis offers livability scores for different ZIP codes, giving you a clearer picture of whether the benefits of a neighborhood align with your personal priorities and risk tolerance. This holistic view can help you make more informed decisions about where to live or invest.
Using Crime Data to Make Better Decisions
Philadelphia's crime rates are shifting, and understanding these changes can help you make more informed decisions about where to live, work, or travel. For instance, violent crime in the city decreased by 9.96% in 2025, while property crime saw an 8.25% drop. But citywide averages only paint part of the picture - neighborhood-level data offers a clearer view, especially when safety is a priority.
Selecting a Neighborhood Using Crime Data
When evaluating neighborhoods, skip general assumptions and dig into specific crime statistics. While Philadelphia’s crime rate is 131% to 165% higher than the national average, some areas stand out as safer. Bustleton, for example, reports 62% less crime than the city average, with 2,072 crimes per 100,000 residents. Chestnut Hill also fares better, with 3,036 crimes per 100,000 people, which is 44% below the city’s overall rate.
It’s worth noting that neighborhoods vary not just in overall crime but in the types of crime residents are likely to encounter. For instance, a neighborhood where the odds of property crime are 1 in 20 requires a different approach than one where the odds of violent crime are 1 in 101. With analysts predicting further declines in crime through late 2025, some areas previously considered risky may now be on the upswing. To get a better sense of safety, visit neighborhoods at different times of the day, look for well-lit streets, active businesses, and signs of community involvement. Talking to residents about local watch programs and police presence can also provide valuable insights.
Once you’ve compared neighborhoods, you can focus on practical strategies for staying safe.
Staying Safe in Philadelphia
No matter where you live or work, staying alert and planning ahead can reduce risks. Stick to well-lit routes, especially after dark, and avoid isolated areas when possible. In neighborhoods with higher crime rates, consider alternative routes and stay aware of your surroundings. Being cautious and prepared can go a long way toward ensuring your safety.
Planning Your Move with AdensZip
Conclusion: Using Philadelphia Crime Data in 2025
Philadelphia saw noteworthy improvements in its crime statistics for 2025: violent crime decreased by 9.96%, and property crime dropped by 8.25%. But while these figures paint a positive picture, they can obscure significant differences at the neighborhood level. To truly understand the safety of a specific area, hyperlocal data is key.
Whether you're moving to a new area or just trying to better understand your current neighborhood, having access to detailed, localized data can make all the difference. While citywide safety trends are encouraging, tools like AdensZip ensure you can evaluate your specific block, empowering you to balance safety with other important lifestyle factors.
FAQs
How does AdensZip combine safety data with livability factors?
AdensZip combines current crime data with important livability aspects such as walkability, access to public transit, local amenities, and nearby parks. Through a weighted scoring system, it assesses both safety and overall quality of life, offering a comprehensive view of each neighborhood.
This method allows users to make smarter choices about where to live, work, or visit by considering crime rates alongside daily conveniences and lifestyle needs.
Why is Chestnut Hill considered one of the safest neighborhoods in Philadelphia?
Chestnut Hill stands out as one of Philadelphia's safest neighborhoods, thanks to its consistently low rates of both violent and property crimes. This reputation is bolstered by features like well-maintained street lighting, active neighborhood watch programs, and a strong sense of community engagement.
Together, these elements foster a welcoming, small-town vibe that leaves both residents and visitors feeling secure as they take in the neighborhood's unique charm.
Why do areas like Upper Kensington and Cobbs Creek experience higher crime rates?
Upper Kensington and Cobbs Creek are areas where crime rates tend to be higher, often linked to issues like drug activity, violent offenses, and property theft. Specific streets and neighborhoods, particularly those associated with open-air drug markets, experience more frequent incidents. The risk of crime can also rise significantly after sunset, so it's important to stay alert and mindful of your surroundings when spending time in or passing through these areas.